The Hypergeometric Distribution
STA 211 · Lecture 10
Introduction
The hypergeometric distribution models sampling without replacement from a finite population containing two types of item. Unlike the binomial model, successive draws are dependent because the population composition changes after each draw.
Learning Objectives
You should be able to:
- recognise hypergeometric sampling;
- determine the correct support;
- calculate probabilities, means and variances;
- apply the finite-population correction; and
- compare hypergeometric and binomial models.
Probability Function
Suppose a population of size contains successes and failures. A sample of size is drawn without replacement. If is the number of successes in the sample, then
The support is
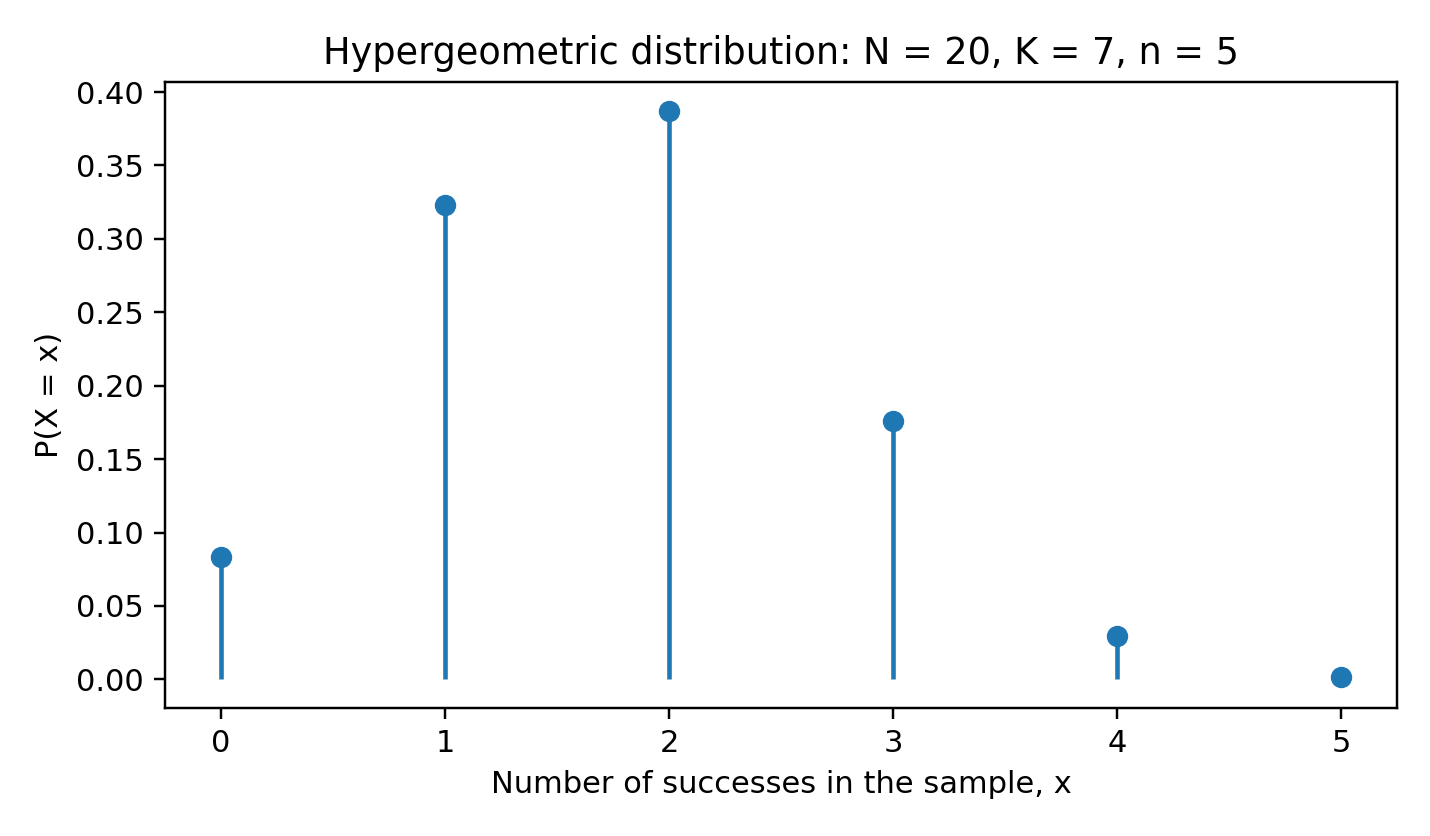
Hypergeometric probability mass function
Mean and Variance
Let
Then
The factor
is the finite-population correction. It makes the hypergeometric variance smaller than the binomial variance because sampling without replacement contains less randomness.
Example 10.1
A batch of 20 components contains 5 defective items. A sample of 4 is selected without replacement. The probability of exactly 2 defects is
The mean is
The variance is
Hypergeometric-to-Binomial Approximation
When the sampling fraction is small, the population composition changes very little and the draws are approximately independent. Then
A common guide is that the approximation is reasonable when , though context and required precision matter.
Example 10.2: Model choice
From a population of 1,000 items with 100 defective items, a sample of 5 gives . A binomial approximation with is usually accurate. From a population of 20 with 2 defective items and a sample of 10, the sampling fraction is 0.5; the exact hypergeometric model is essential.
Post-Test
- State the difference between binomial and hypergeometric sampling.
- A population of 30 contains 8 successes. A sample of 6 is selected without replacement. Find .
- For Question 2, find and .
- Explain the finite-population correction.
- When is a binomial approximation to the hypergeometric distribution reasonable?
Selected answers: 2. ; 3. and .